
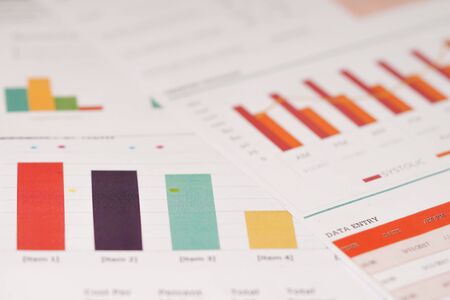
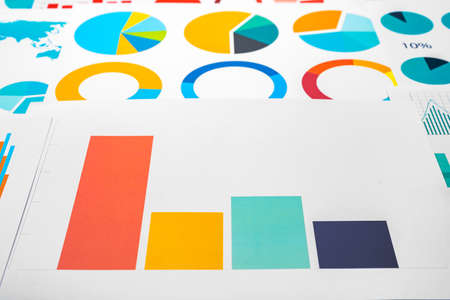
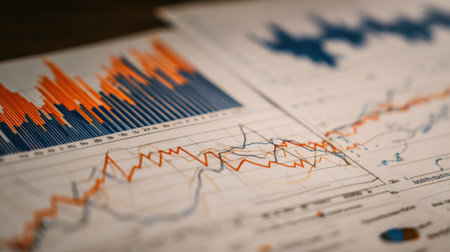
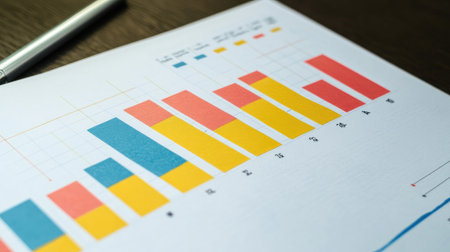
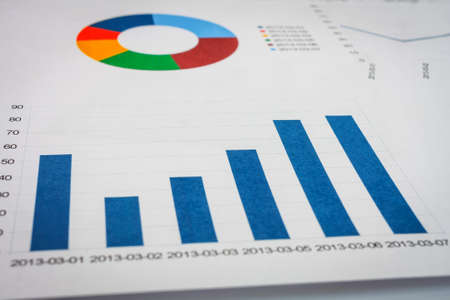
Charts Graphs spreadsheet paper. Financial development, Banking Account, Statistics, Investment Analytic research data economy, Stock exchange Business office company meeting concept.
Коллекция по умолчанию
Коллекция по умолчанию
Создать новую
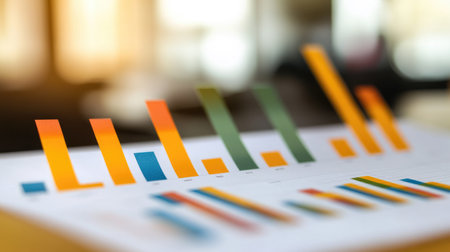
graph chart of stock market investment trading.
Коллекция по умолчанию
Коллекция по умолчанию
Создать новую

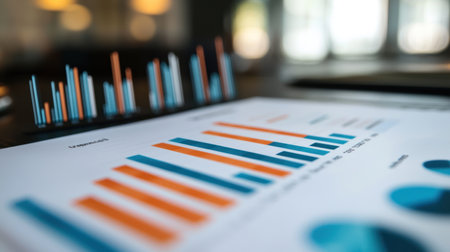
chart or graph paper. Financial, account, statistics and business data concept.
Коллекция по умолчанию
Коллекция по умолчанию
Создать новую
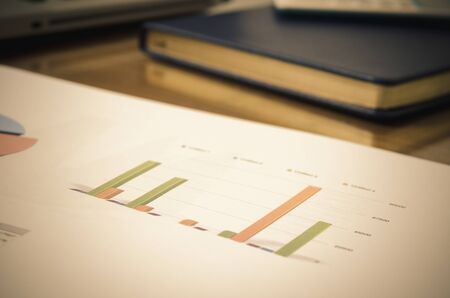
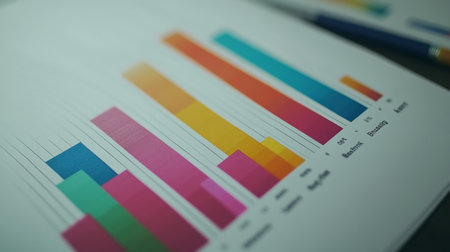
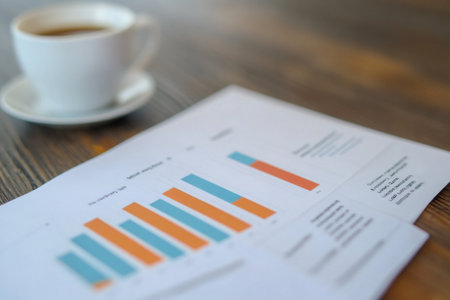
A close-up of a printed bar graph with colorful segments, highlighting financial performance and business metrics in a conference room setting.
Коллекция по умолчанию
Коллекция по умолчанию
Создать новую
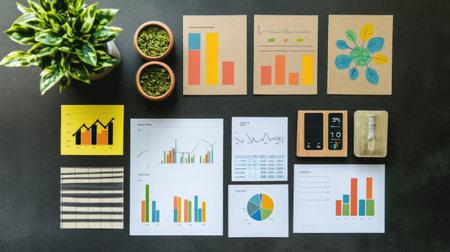
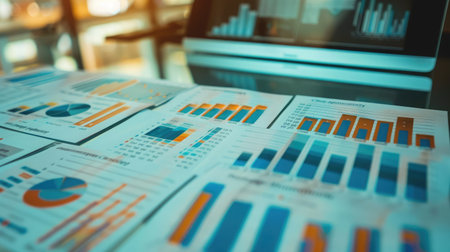
A visually engaging workspace featuring colorful charts and graphs alongside planters, ideal for presentations, data analysis, and professional brainstorming sessions.
Коллекция по умолчанию
Коллекция по умолчанию
Создать новую
Close up of business graph analysis document
Коллекция по умолчанию
Коллекция по умолчанию
Создать новую
People take view business growth graphs
Коллекция по умолчанию
Коллекция по умолчанию
Создать новую
Data financial instruments chart, downtrend stock market analysis report
Коллекция по умолчанию
Коллекция по умолчанию
Создать новую

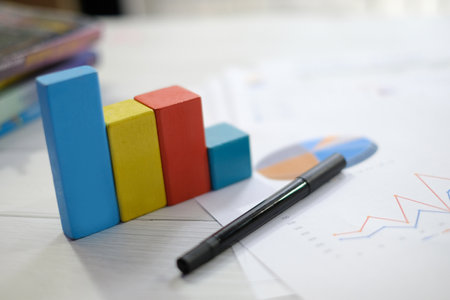
Close up image of colored wooden blocks as a graph
Коллекция по умолчанию
Коллекция по умолчанию
Создать новую

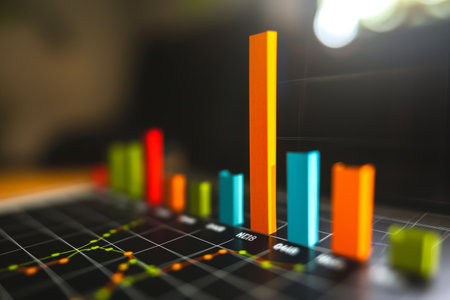
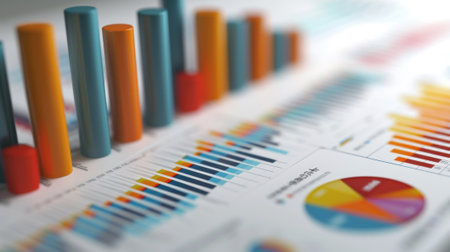
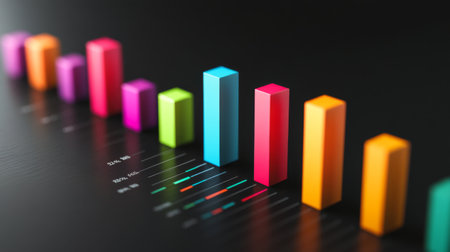
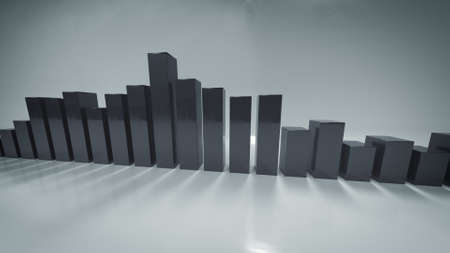
A colorful 3D bar graph rising dramatically on a reflective surface, symbolizing growth and success in business performance metrics.
Коллекция по умолчанию
Коллекция по умолчанию
Создать новую
business background grown up concept the business chart document background.
Коллекция по умолчанию
Коллекция по умолчанию
Создать новую
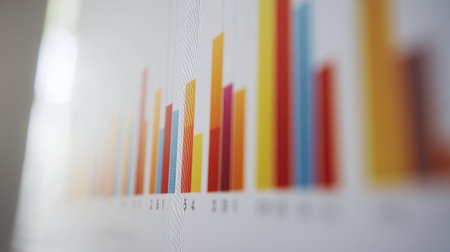
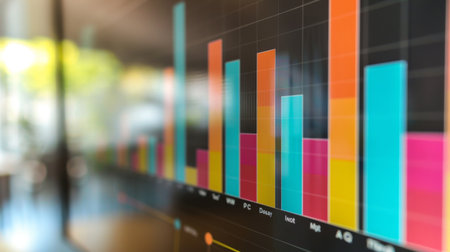
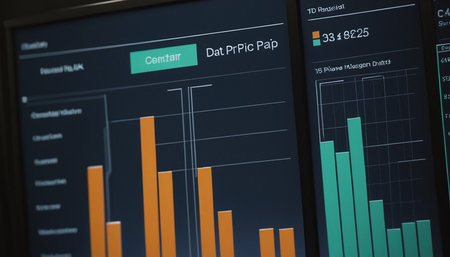
Vibrant bar graph displayed on a digital screen, showcasing data insights and trends for business analysis. Ideal for presentations and reports.
Коллекция по умолчанию
Коллекция по умолчанию
Создать новую

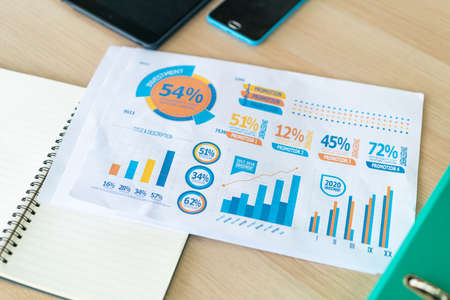
Business of financial analytics desktop with accounting charts and diagrams
Коллекция по умолчанию
Коллекция по умолчанию
Создать новую
Stock Market Chart on Blue Background. share drop down and stock up
Коллекция по умолчанию
Коллекция по умолчанию
Создать новую
Close up of business graph analysis document
Коллекция по умолчанию
Коллекция по умолчанию
Создать новую
Business performance analysis. Business Graphs with Keyboard, pen.
Коллекция по умолчанию
Коллекция по умолчанию
Создать новую
Medium shot of a closeup on charts and graphs illustrating loan interest rate fluctuations over time
Коллекция по умолчанию
Коллекция по умолчанию
Создать новую
A colorful bar chart representing stock performance over time, with various heights and vibrant colors, set against a clean, professional backdrop.
Коллекция по умолчанию
Коллекция по умолчанию
Создать новую
Business themed presentation templates. Background with papers full of graphs and executive glasses. Folder with papers full of graphs and glasses on a table. High quality photo
Коллекция по умолчанию
Коллекция по умолчанию
Создать новую
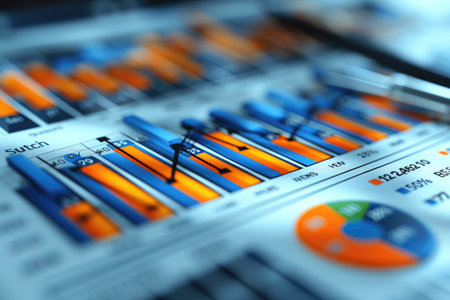
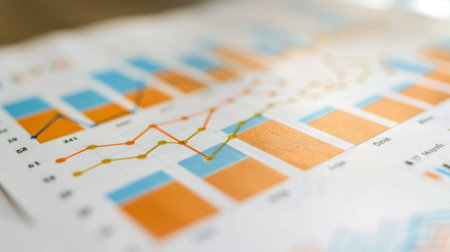
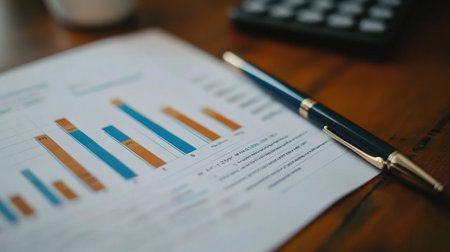
Close-up of a printed financial graph with colorful bar charts and line indicators, displayed on a desk alongside financial documents and a calculator.
Коллекция по умолчанию
Коллекция по умолчанию
Создать новую
Charts, diagrams, tables. Workplace for the business person.
Коллекция по умолчанию
Коллекция по умолчанию
Создать новую
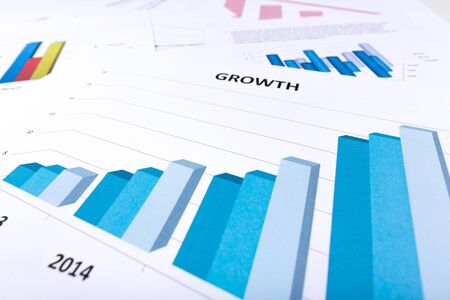
Financial Analysis with graphs and data of industrial growth.
Коллекция по умолчанию
Коллекция по умолчанию
Создать новую
Histograms
Коллекция по умолчанию
Коллекция по умолчанию
Создать новую
Charts Graphs paper. Financial development, Banking Account, Statistics, Investment Analytic research data economy, Stock exchange Business office company meeting concept.
Коллекция по умолчанию
Коллекция по умолчанию
Создать новую

Analysis of data from graphs. select focus.
Коллекция по умолчанию
Коллекция по умолчанию
Создать новую
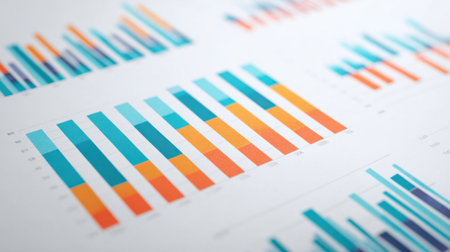
A professional bar chart with bold, colorful bars rising in front of a clean, minimalist grid background, symbolizing financial performance and growth
Коллекция по умолчанию
Коллекция по умолчанию
Создать новую

responsibility and cooperation of the working team Business cash, business concept
Коллекция по умолчанию
Коллекция по умолчанию
Создать новую
Analysis data graph professional photography
Коллекция по умолчанию
Коллекция по умолчанию
Создать новую
Business graph analysis documents on gray background
Коллекция по умолчанию
Коллекция по умолчанию
Создать новую
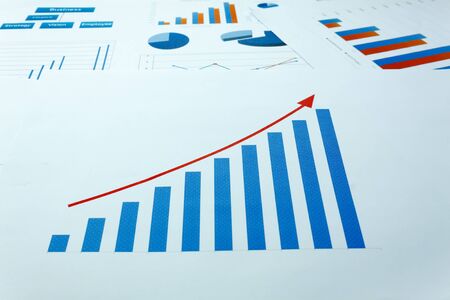
Graph showing economic growth
Коллекция по умолчанию
Коллекция по умолчанию
Создать новую
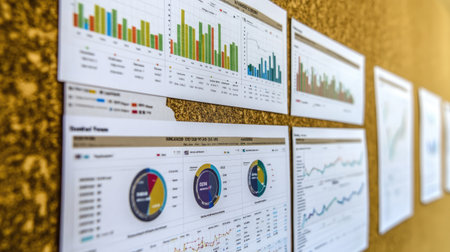
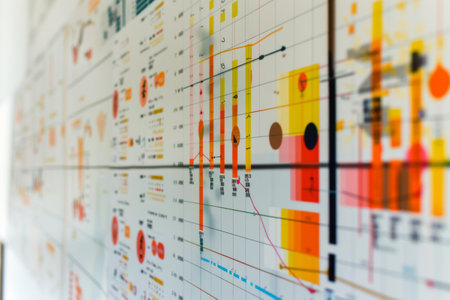
This image showcases a bulletin board displaying various business performance metrics through colorful charts and graphs, ideal for professional analysis and team discussions.
Коллекция по умолчанию
Коллекция по умолчанию
Создать новую
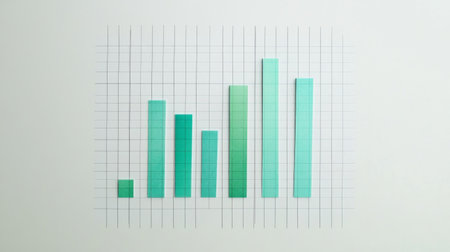
This image showcases a colorful bar graph that visualizes data insights for business analysis. The vibrant colors highlight various metrics and trends.
Коллекция по умолчанию
Коллекция по умолчанию
Создать новую
Business document Financial chart and graph.
Коллекция по умолчанию
Коллекция по умолчанию
Создать новую
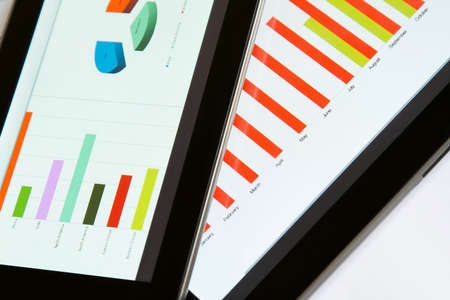
Working, analyzing graphics with the tablet
Коллекция по умолчанию
Коллекция по умолчанию
Создать новую
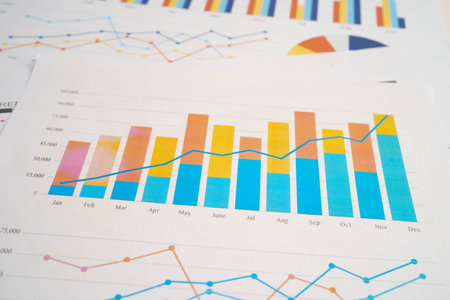
Chart graph paper. Finance, account, statistic, investment data economy, stock exchange business.
Коллекция по умолчанию
Коллекция по умолчанию
Создать новую
A close up of financial report with graphs showcasing data analysis and investment trends
Коллекция по умолчанию
Коллекция по умолчанию
Создать новую

A close-up of colorful wooden blocks arranged on a vibrant abstract background. This image captures creativity, playfulness, and artistic design, ideal for educational materials or decor.
Коллекция по умолчанию
Коллекция по умолчанию
Создать новую
Development and growth concept. Businessman plan growth and increase of positive indicators in his business.
Коллекция по умолчанию
Коллекция по умолчанию
Создать новую
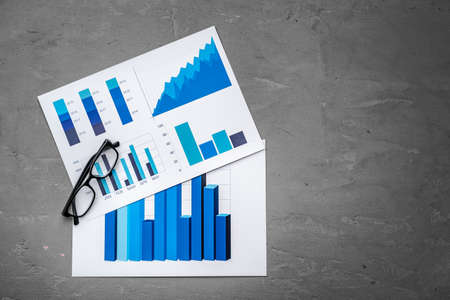
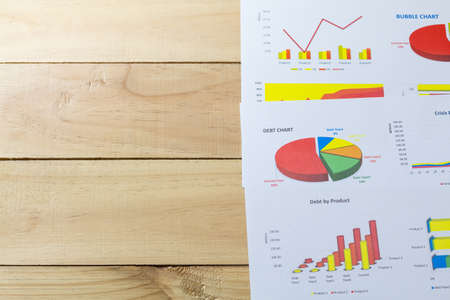
Financial paper with charts and diagrams on gray table
Коллекция по умолчанию
Коллекция по умолчанию
Создать новую
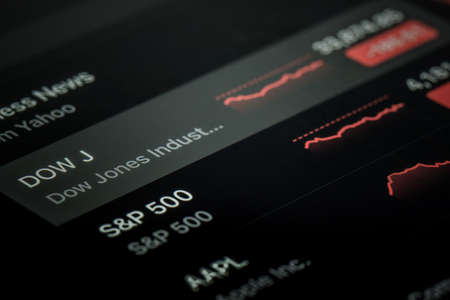
A stock market graph on a black background.
Коллекция по умолчанию
Коллекция по умолчанию
Создать новую
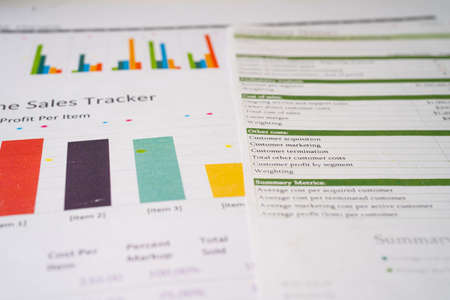
A detailed view of a bar chart placed on a table, showcasing data through precise and visually appealing bars, A bar chart showing net revenue from various trading platforms, AI Generated
Коллекция по умолчанию
Коллекция по умолчанию
Создать новую
A financial bar chart showing comparison of investment returns, with green bars rising sharply to symbolize growth, displayed against a white background with grid lines.
Коллекция по умолчанию
Коллекция по умолчанию
Создать новую
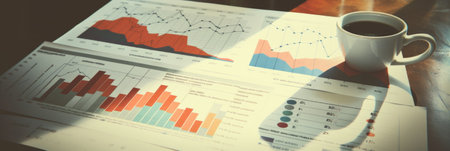
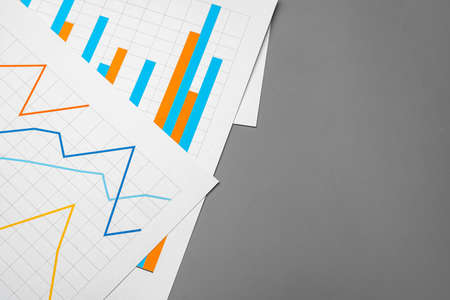
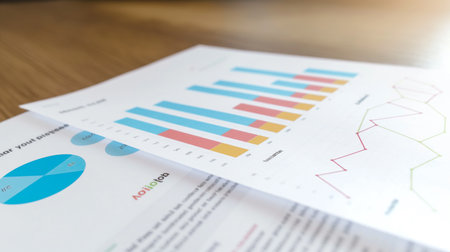
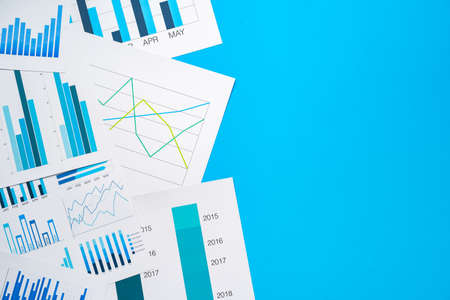
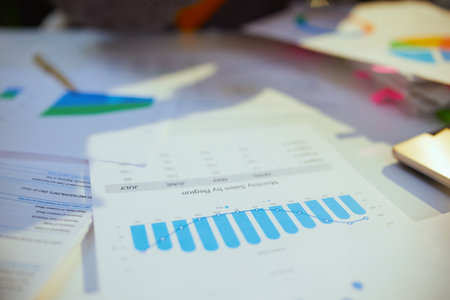
Graphs and charts on paper showing financial planning.
Коллекция по умолчанию
Коллекция по умолчанию
Создать новую
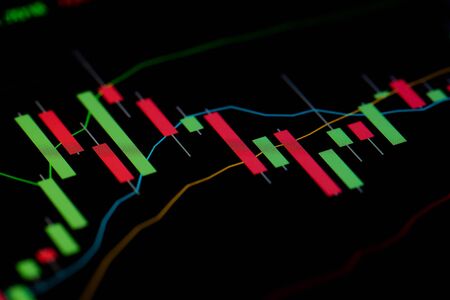
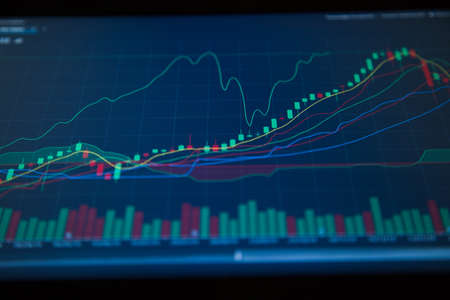
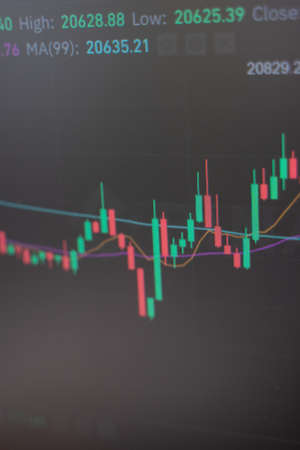
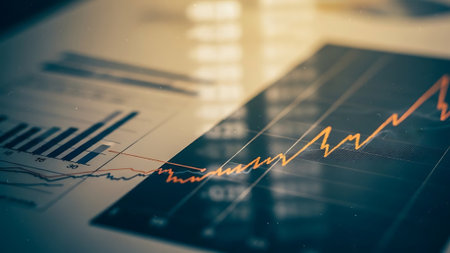
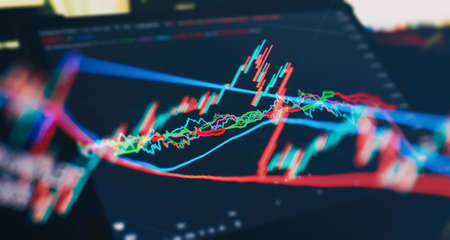
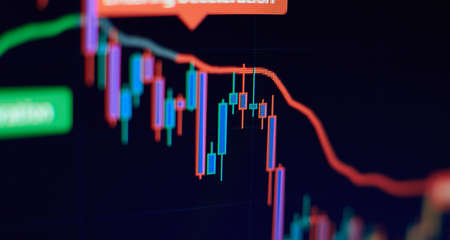
Close up shot on digital screen Candlestick Chart of stock market change and volatility prices profit or loss
Коллекция по умолчанию
Коллекция по умолчанию
Создать новую
A close-up of a vertical bar chart with varying heights of bars, highlighting trends and comparisons between different data sets with a clean, white background
Коллекция по умолчанию
Коллекция по умолчанию
Создать новую
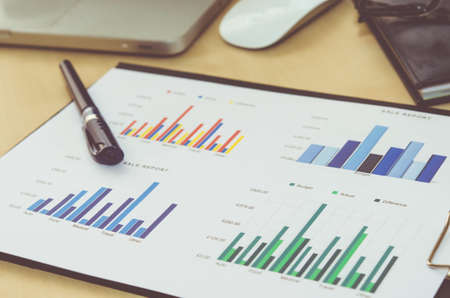
Financial document showing bar charts and data on a wooden table, representing business analysis and marketing strategy
Коллекция по умолчанию
Коллекция по умолчанию
Создать новую
Financial paper with charts and diagrams on gray table
Коллекция по умолчанию
Коллекция по умолчанию
Создать новую
Our profits are on the rise. Shot of paperwork and stationery on a desk in an empty office during the day.
Коллекция по умолчанию
Коллекция по умолчанию
Создать новую
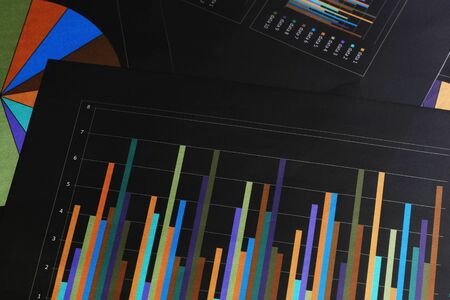
A stack of printed bar graphs and ter plots are seen in closeup symbolizing the tangible results obtained through data visualization and ysis
Коллекция по умолчанию
Коллекция по умолчанию
Создать новую

Financial paper with charts and diagrams on gray table
Коллекция по умолчанию
Коллекция по умолчанию
Создать новую
Business paperwork present with diagram.
Коллекция по умолчанию
Коллекция по умолчанию
Создать новую
business graph on the desk.
Коллекция по умолчанию
Коллекция по умолчанию
Создать новую
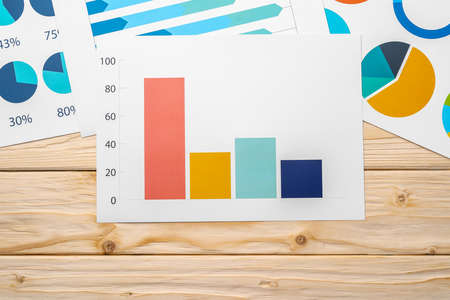
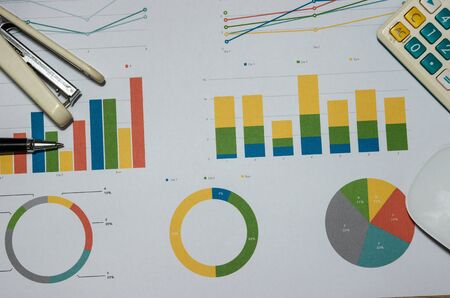
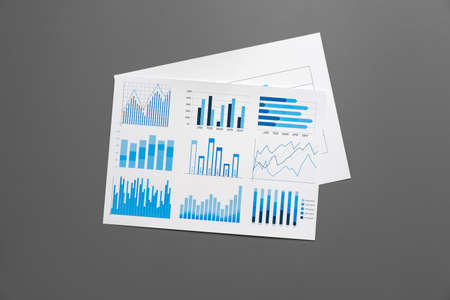
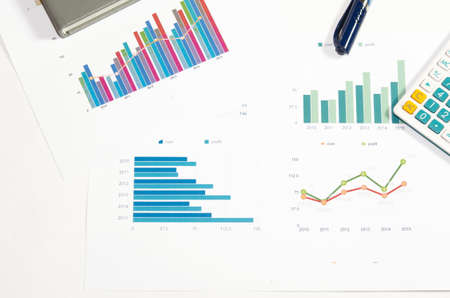
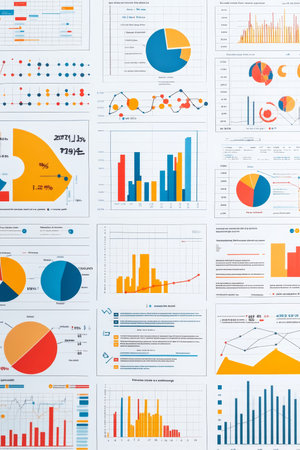
A variety of financial charts and graphs, including pie charts and bar graphs, are presented on a clean white background, illustrating data analysis.
Коллекция по умолчанию
Коллекция по умолчанию
Создать новую
A close-up of a line graph showing fluctuating trends, used to analyze market behavior or performance over time.
Коллекция по умолчанию
Коллекция по умолчанию
Создать новую
A timeline chart showing events and milestones over time AI generated
Коллекция по умолчанию
Коллекция по умолчанию
Создать новую
Business charts and startup roadmap printed for discussion in meeting setup
Коллекция по умолчанию
Коллекция по умолчанию
Создать новую

Stock index on the computer monitor . Financial data on a monitor which including of Market Analyze. Bar graphs, Diagrams, financial figures.
Коллекция по умолчанию
Коллекция по умолчанию
Создать новую
A vibrant 3D bar chart illustration on a dark background, perfect for showcasing data analysis, metrics, and business insights. Ideal for presentations.
Коллекция по умолчанию
Коллекция по умолчанию
Создать новую
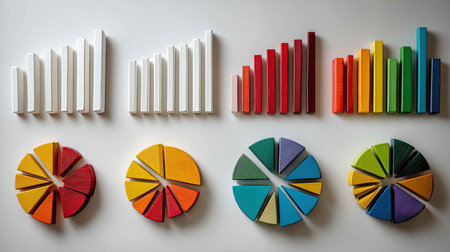
A vibrant display of wooden blocks arranged as bar graphs and pie charts. This creative visual showcases data representation in a playful and engaging manner.
Коллекция по умолчанию
Коллекция по умолчанию
Создать новую
A vibrant bar graph on a computer screen, illustrating sales performance over different quarters.
Коллекция по умолчанию
Коллекция по умолчанию
Создать новую
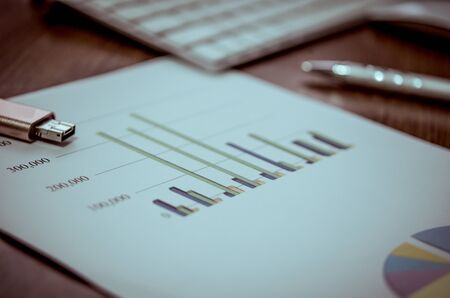
Office workplace table with report pages with financial data
Коллекция по умолчанию
Коллекция по умолчанию
Создать новую
Change the stock market chart. The fall in the value of cryptocurrencies. Brokerage data
Коллекция по умолчанию
Коллекция по умолчанию
Создать новую

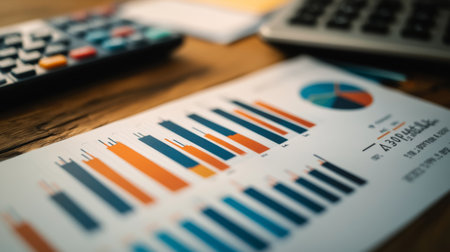
Business analyzing report on chart with laptop and calculator
Коллекция по умолчанию
Коллекция по умолчанию
Создать новую
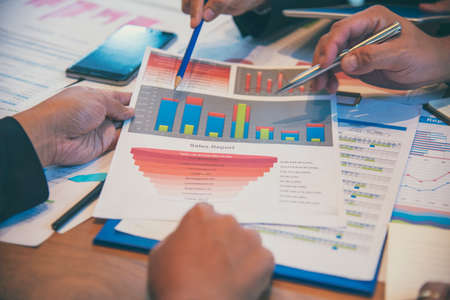
Group of business people meeting in conference room brainstorming consult business document graph chart office desk. Diversity multiethnic group of business people brainstorming and working together.
Коллекция по умолчанию
Коллекция по умолчанию
Создать новую
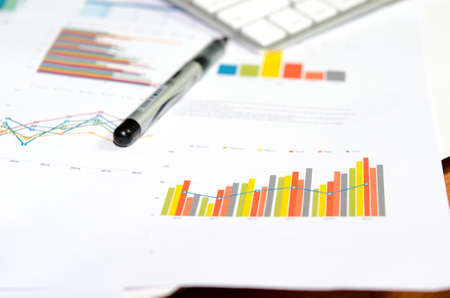
Financial graphs analysis and pen.
Коллекция по умолчанию
Коллекция по умолчанию
Создать новую

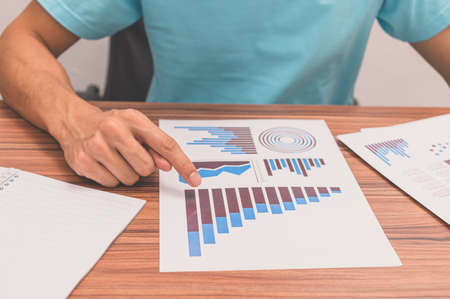
top view of man hand with pen analyzing bar chart on paper.
Коллекция по умолчанию
Коллекция по умолчанию
Создать новую
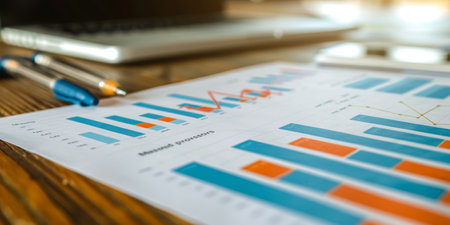
A bar graph on a desk with a laptop in the background.
Коллекция по умолчанию
Коллекция по умолчанию
Создать новую

The business plan at the meeting and analyze financial numbers to view the performance of the company.
Коллекция по умолчанию
Коллекция по умолчанию
Создать новую

Business paperwork present with diagram.
Коллекция по умолчанию
Коллекция по умолчанию
Создать новую
Notebook showing creative mind maps, charts, and highlighted study material for visual learners
Коллекция по умолчанию
Коллекция по умолчанию
Создать новую
A close-up of a banking report featuring detailed financial graphs, with a pen and calculator placed nearby, symbolizing the analysis of financial performance.
Коллекция по умолчанию
Коллекция по умолчанию
Создать новую
Stock market or forex trading graph and candlestick chart suitable for financial investment concept. Abstract finance background.
Коллекция по умолчанию
Коллекция по умолчанию
Создать новую
Business documents at workplace, financial report, close up
Коллекция по умолчанию
Коллекция по умолчанию
Создать новую
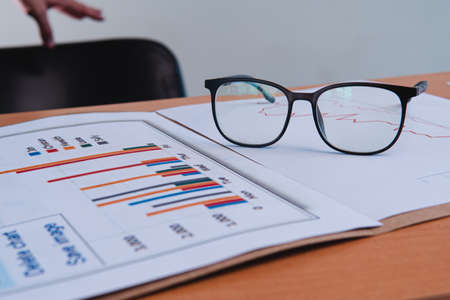
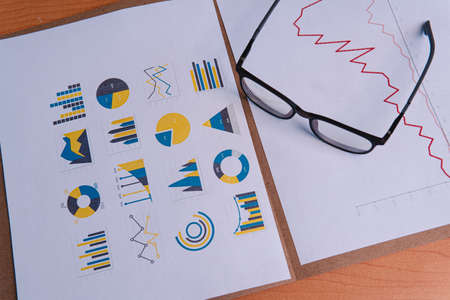
Work table of a businessman with papers, graphs and glasses. Business presentation template with papers, folder and a chair in the background. High quality photo
Коллекция по умолчанию
Коллекция по умолчанию
Создать новую
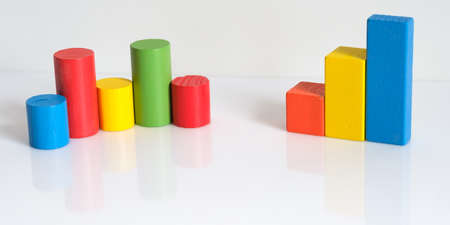
Wooden blocks in the form of graphs. Business concept
Коллекция по умолчанию
Коллекция по умолчанию
Создать новую
business woman working with documents and graphs.
Коллекция по умолчанию
Коллекция по умолчанию
Создать новую
Business statistics and Analytics value . Abstract glowing forex chart interface background. Investment, trade, stock, finance and analysis concept.
Коллекция по умолчанию
Коллекция по умолчанию
Создать новую
Financial data analyzing on monitor. Abstract financial data analysis on monitor.
Коллекция по умолчанию
Коллекция по умолчанию
Создать новую
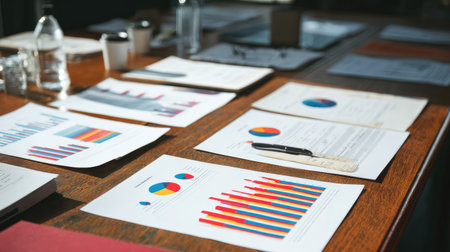
A set of financial charts and graphs printed on paper, spread out on a glass table.
Коллекция по умолчанию
Коллекция по умолчанию
Создать новую
Analysis data graph professional photography
Коллекция по умолчанию
Коллекция по умолчанию
Создать новую
Gray bars of spectrum analyzer with reflection. Abstract music concept. 3D render illustration
Коллекция по умолчанию
Коллекция по умолчанию
Создать новую

Eyeglasses on financial document
Коллекция по умолчанию
Коллекция по умолчанию
Создать новую

Shallow depth of field (selective focus) with details of a candlestick chart on a computer screen.
Коллекция по умолчанию
Коллекция по умолчанию
Создать новую

different wooden blocks on white background, leadership and team concept
Коллекция по умолчанию
Коллекция по умолчанию
Создать новую
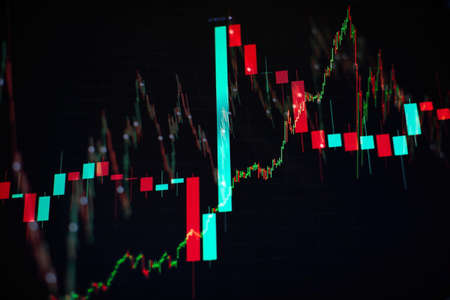
Business graph. Bullish Bearish trend. Candlestick chart uptrend downtrend . Stock trade on online market forex.
Коллекция по умолчанию
Коллекция по умолчанию
Создать новую
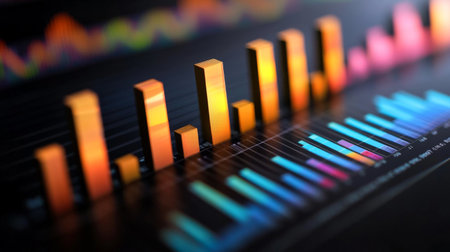
A close-up of a D bar chart showing business growth and financial trends, with a dark gradient background and reflective surfaces for a sleek look.
Коллекция по умолчанию
Коллекция по умолчанию
Создать новую
Business documents.
Коллекция по умолчанию
Коллекция по умолчанию
Создать новую
Vibrant abstract visual of colored bar graphs showcasing data analysis in a modern design. Suitable for business and technology presentations.
Коллекция по умолчанию
Коллекция по умолчанию
Создать новую
Business paperwork present with diagram.
Коллекция по умолчанию
Коллекция по умолчанию
Создать новую

Business growth chart on a desk with colorful sticky notes, symbolizing entrepreneurship, with copy space
Коллекция по умолчанию
Коллекция по умолчанию
Создать новую
close-up business graph paper on working table
Коллекция по умолчанию
Коллекция по умолчанию
Создать новую
Business document paper placed on a white scene
Коллекция по умолчанию
Коллекция по умолчанию
Создать новую

Working, analyzing graphics with the tablet and doing calculations
Коллекция по умолчанию
Коллекция по умолчанию
Создать новую
Stock or business market analysis concept. Business financial or stock market background.
Коллекция по умолчанию
Коллекция по умолчанию
Создать новую

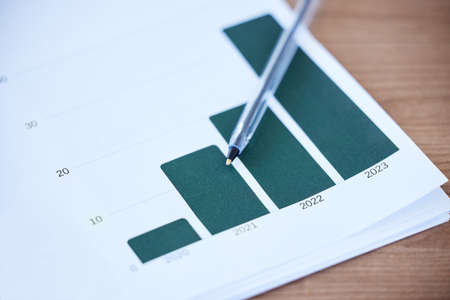
ballpoint pen indicates income graphs lying on the table
Коллекция по умолчанию
Коллекция по умолчанию
Создать новую
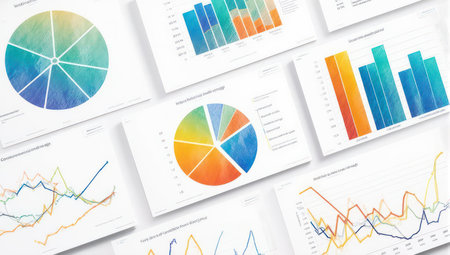
A bunch of graphs are shown on a white background. The graphs are colorful and have different shapes. Scene is informative and analytical
Коллекция по умолчанию
Коллекция по умолчанию
Создать новую
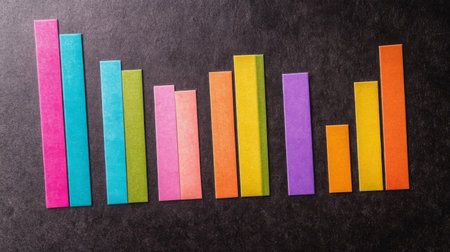
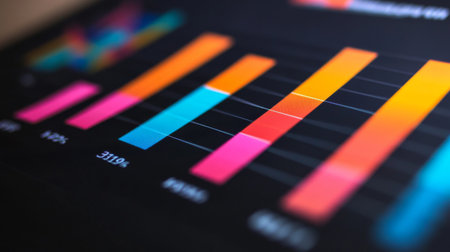
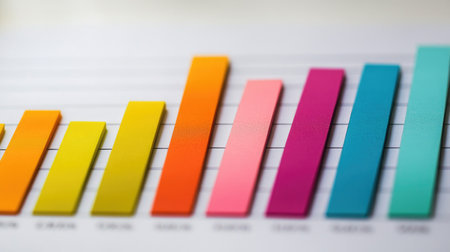
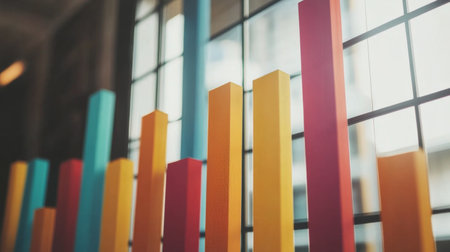
Vibrant paper bars arranged on a dark surface, ideal for representing data trends or statistics in presentations and reports. Perfect for creative projects.
Коллекция по умолчанию
Коллекция по умолчанию
Создать новую
Marketing Analysis Charts, Graphs, and Data Visualization on a Wall, Business Concept
Коллекция по умолчанию
Коллекция по умолчанию
Создать новую
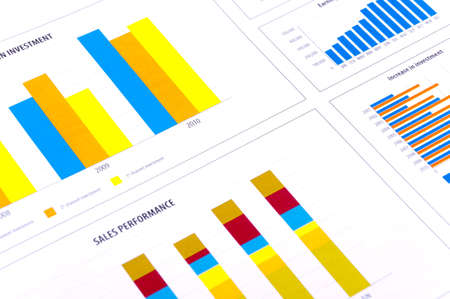
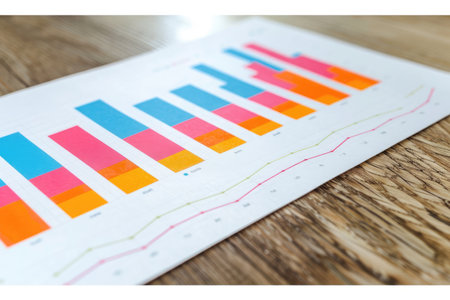
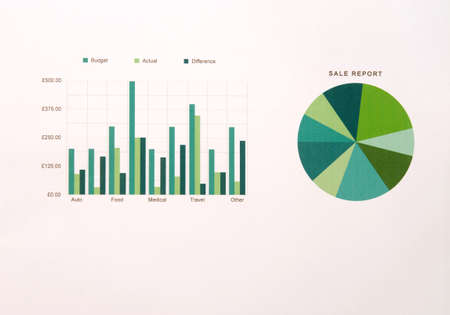
Bar Graph, Chart and Line Graph. Green, red and blue bar graphs on my sample report that print out to show line and chart graphs. Budget and planning report concept.
Коллекция по умолчанию
Коллекция по умолчанию
Создать новую

close up asian barista business owner show business plan to financial advisor about loan contract for open new restaurant business.small business entrepreneur
Коллекция по умолчанию
Коллекция по умолчанию
Создать новую
Legion-Media
Создайте свои проекты на основе качественных стоковых фотографий и видео.


Copyright © Legion-Media.